A good activation metric is not the event that looks nice in the onboarding dashboard. It is the early behavior that predicts a user will still be around later.
Short answer: an activation metric predicts retention only when users who complete that early behavior retain materially better than users who do not, across segments and a later holdout cohort.
That sounds obvious until the dashboard is full of fake wins: signup completed, checklist finished, profile updated, invite sent. Some of those events matter. Some are just users doing chores before they leave.
Amplitude’s 2025 benchmark writing makes the timing problem hard to ignore: products with stronger week-one activation also performed better on three-month retention, and a 7% day-seven return rate marked the top quartile in its analysis. The point is not to worship that number. The point is that retention often gets decided before the next roadmap review.
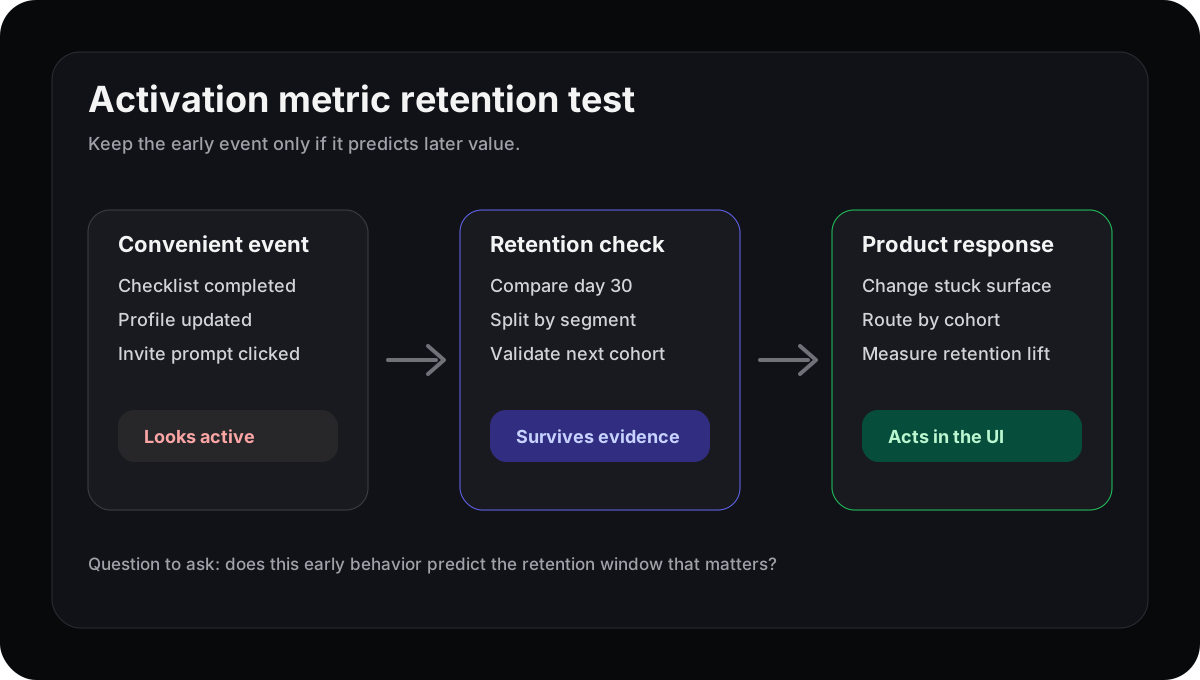
The useful activation event survives a retention check. The convenient one only survives a dashboard review.
What makes an activation metric predictive?
A predictive activation metric has three properties: it happens early, it maps to real product value, and it separates retained users from churned users in a later cohort. If the event only proves that a user completed onboarding, it is a setup metric, not a retention metric.
The wrong activation metric is expensive
Bad activation metrics usually share one flaw: they measure completion, not value.
A user can complete setup and never solve the problem that brought them in. Another user can skip half the onboarding flow, connect the right data source, and return every week. If both users get scored by checklist progress, the weaker user looks healthier.
This is why onboarding checklist completion is a dangerous scoreboard. It tells you who obeyed the flow. It does not tell you who reached a value moment.
Amplitude separates time to activation from time to value for the same reason. Creating a project might be activation. Seeing that project solve the workflow is value. Mixpanel’s retention guide makes a similar point: product teams should look for where users drop before the value moment, not only before payment.
How to test whether activation predicts retention
You do not need a perfect model. You need a sharper comparison.
Start with one signup cohort. Pick five candidate activation events from the first seven days. For each event, compare later retention for users who did it versus users who did not. Use a window that matches the product: day 30 for a frequent workflow, week 8 or month 3 for slower B2B usage.
Then add two checks:
| Test | Why it matters |
|---|---|
| Segment split | The metric may work for admins but fail for viewers |
| Holdout cohort | A predictor from last month may be noise this month |
The winning metric should be specific enough to act on. “Created workspace” is usually too broad. “Connected source data and viewed the first live report” is closer to a product response.
PostHog’s activation writing is useful here because it treats activation as product-specific, not universal. A company with many products may need different activation metrics for different jobs. That is the right instinct. One global metric often hides the behavior that matters for each cohort.
Turn the metric into a product response
Once you find the predictive behavior, the work is not done.
If retained users usually connect a data source, build the product around getting the right user to that step. If retained users invite a teammate only after seeing a live report, do not prompt the invite first. If retained users return after creating a saved view, make the empty state push toward that view instead of toward generic setup.
This is the same lesson from feature adoption. First touch is not enough. Repeat value is the signal.
Rayform’s angle is the last mile: use existing behavioral telemetry to adapt the interface for the cohort that has not reached the predictive behavior yet. The dashboard can tell you which event matters. The product still has to respond while the user is in the moment.
Try this this week
Pick one activation metric your team already reports.
Ask one blunt question: among users who hit this event in their first week, how many are still active in the retention window that matters? Then compare that to users who skipped the event.
If the gap is small, stop optimizing the event. Find a better predictor. If the gap is large, write the product rule: which cohort is missing the behavior, what surface should change, and which retention metric proves the response worked.
See how Rayform turns behavioral signals into runtime UI changes.