The experiment won. Signups rose. Everyone wanted to ship it.
Then support tickets jumped, setup got slower for enterprise workspaces, and the “winner” started to look less like a win.
Short answer: guardrail metrics are the safety signals that keep a product experiment from optimizing one number while damaging the user experience, business, or a specific cohort. A good experiment names the primary metric, the guardrail, the owner, and the rollback rule before traffic moves.
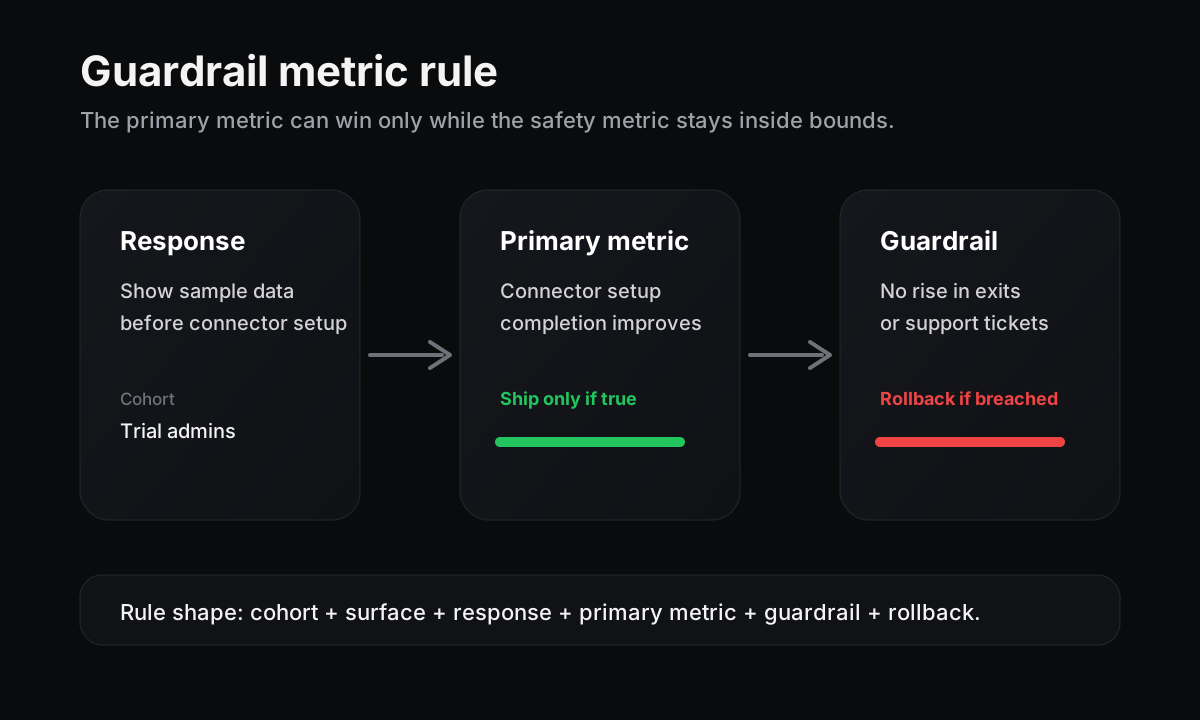
The primary metric says what should improve. The guardrail says what must not get worse.
A local win can still be a bad product decision
Statsig’s guardrail metrics guide makes the basic point clearly: a primary metric measures the experiment goal, while a guardrail protects the broader product. A checkout change can lift completion and still increase payment errors. A recommendation change can lift clicks and still hurt retention. A faster onboarding path can create more activated accounts and more confused users.
Amplitude’s experiment docs use the same split. The primary metric should be the single behavior the variant directly affects. Guardrails watch performance, quality, core engagement, or business health, such as page load time, app crash rate, failed transactions, support ticket volume, cancellations, or refunds.
That matters more when product teams start routing UI responses from behavioral telemetry. The product can react faster, which is good. It can also spread a bad local optimization faster.
Write the guardrail before the variant
Do not add guardrails after the readout gets uncomfortable. Write them into the experiment rule:
| Product response | Primary metric | Guardrail | Rollback |
|---|---|---|---|
| Shorter setup path for trial admins | Connector setup completion | No increase in setup exits or support tickets | Return to default if either rises 10% for two days |
| Upgrade prompt after team invite | Trial-to-paid conversion | No drop in teammate activation | Stop prompt for cohorts below baseline activation |
| In-app guide for ignored feature | Repeat feature use | No increase in dismissals or negative feedback | Remove guide after 500 views if dismissals spike |
The guardrail should be close enough to catch harm, but not so broad that every experiment drowns in noise. Statsig warns that more guardrails are not always better because every added metric increases the chance of confusing random movement for a real problem.
Separate hard stops from diagnostics
Not every metric deserves the same power.
A hard guardrail can pause or roll back the response. Payment error rate, crash rate, setup exits, unsubscribe rate, and support-ticket spikes often belong here because the cost is obvious.
A diagnostic metric is different. It helps explain what happened, but it does not automatically stop the experiment. Session length, secondary feature clicks, tooltip opens, or page depth might be useful readout context. They are not always safety limits.
Kameleoon frames guardrails as governance for experimentation. That word can sound heavy, but the practical version is small: decide which metric can veto the rollout, who owns the decision, and what action happens when the line is crossed.
Guardrails need cohort limits
A product-wide guardrail can hide the exact group getting hurt.
If an onboarding shortcut helps small teams and hurts enterprise admins, the average may look fine. If an upgrade prompt works for active workspaces and annoys invited teammates, a global conversion metric will miss the mess.
So pair the guardrail with the cohort and surface:
| Field | Example |
|---|---|
| Cohort | Trial admins with three invited teammates |
| Surface | Connector setup, step three |
| Response | Show sample data before asking for credentials |
| Primary metric | Connector completion within one session |
| Guardrail | No increase in setup exits or support tickets |
| Review window | 500 exposed workspaces or seven days |
This is where bandit testing still needs routing rules. Allocation can move traffic. It cannot decide which cohort should be protected.
Where Rayform fits
Rayform sits in the response layer. Your analytics and experimentation stack can keep measuring events, flags, variants, and readouts. Rayform uses trusted behavioral telemetry to adapt the UI at runtime inside rules the team approves.
That rule should never be just “show the thing that lifts clicks.” It should be: for this cohort, on this surface, show this response while this primary metric improves and this guardrail stays safe.
That is also why experiment velocity starts before launch. Speed is only useful when the safety rule is already written.
Try this before your next product experiment: write one sentence with the response, primary metric, guardrail, owner, and rollback. If the sentence is hard to write, the experiment is not ready to control the product yet.
See how Rayform turns behavioral signals into runtime UI changes.